Services in Sandboxes
This article explains how to use services in sandboxes. For additional information about CloudShell services, see Services Overview.
In this article:
Find services
To view services:
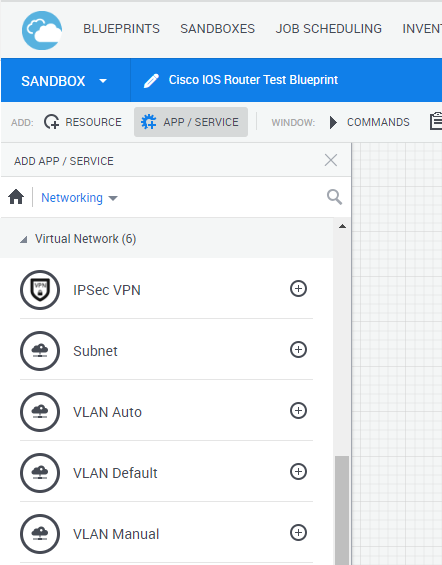
- In the Diagram view, in the toolbar, click App / Service.
The Add App / Service catalog is displayed.
Browse the catalog by selecting a services folder or by using the text search.
The list of folder items are displayed, grouped by the service families.
Add services
Note: You cannot add, edit or remove Subnet services in the sandbox.
To add a service to the diagram:
Click the ‘+’ icon or drag it from the catalog into the diagram.
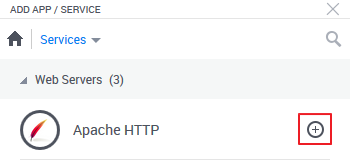
The Add Service dialog box is displayed.
- Fill in any required fields.
- Click Add.
Remove services
To remove a service from the diagram:
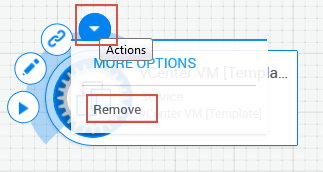
- Select the required service.
Hover over the Actions menu, select More Options and then select the Remove option .
Run service commands
To run a service command:
- In an active sandbox, select the required service.
From the Actions menu, select Commands.
The Commands pane is displayed.
- In the Commands pane, next to the required command name, click Run or Deploy.
Remotely connecting to a service
This option is enabled for services that have an IP address or hostname.
It is possible to connect remotely to a device via RDP, SSH, VNC, or Telnet using the address and user credentials specified on the service. RDP, SSH and Telnet are available by default, while VNC must be configured by the administrator.
To connect to a device via remote protocol:
- In Diagram view, hover over the service. The Actions menu is displayed.
In List view, in the required service's row, click the Actions menu.
Select the remote connection option:
- RDP
- SSH
- Telnet
- VNC
If prompted, perform additional steps, such as selecting the Windows application to use or entering the username and password to the device.
The device is displayed in a Windows application, or in your web browser (if the QualiX Solution Pack is installed).
Activity Feed for a service in the sandbox
The Activity Feed pane enables you to display system messages and command execution progress for a specific service in the sandbox.
For information about the activity feed for a resource or App in the sandbox, see Activity Feed for a Resource in the Sandbox and Activity Feed for an App in the sandbox, respectively.
To open a component's Activity Feed:
- In the sandbox, click the component's live status icon. Alternatively, hover over the component and from the Actions menu, select View Activity.
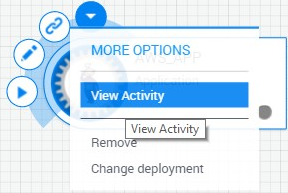
The Activity Feed pane is displayed, listing the last 30 entries.
Tip: Scroll to the bottom to display additional entries.
- To change the time format of the entries, click the
 button. By default, the time elapsed is displayed for each entry.
 To narrow down your search for entries, use the search and filtering options. Click the
 button to show the filters.
Note that the search and filters apply to all entries in the Activity Feed, not just the last 30.
- Search feed field: search for entries that include a word or phrase.
- Error option: display errors that occurred in the sandbox
- Has output option: display entries that have an output
- Component drop down list: display entries that are related to a specific resource, App or service in the sandbox. The value Component displays entries for all components.
- Event type drop down list: display entries of a specific type. Values are: Event type (all entries), Command, Resource, Service and Sandbox.
For more detailed information about a particular error, see Activity Feed Pane.