Sandbox Workspace
The sandbox workspace enables you to browse the available resources, services, Apps and connections defined for the sandbox. You can review the instructions and activity feed, and launch blueprint commands (if available). The resources displayed on the diagram and their connections update in real time as their state changes. Depending on your permissions level, you can pull in additional resources into the sandbox or remove existing resources. If you have obtained a license for the Save and Restore paid add-on, you can also save a sandbox.
Note: An active blueprint is considered a sandbox.
In this article:
Navigating the sandbox workspace
In the image below, hover over an area or option to learn more about it, or use the table that follows.
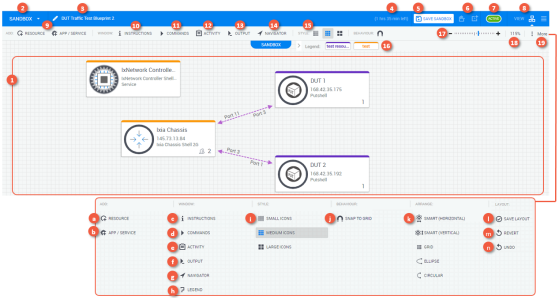
| 1 | The canvas displays the different resources, services and apps in the sandbox, and their connectivity. Here you can perform different actions on the sandbox and its elements like connecting/disconnecting routes, running orchestration and resource commands and deploying Apps. | ||||||||||||||||||||||||||||
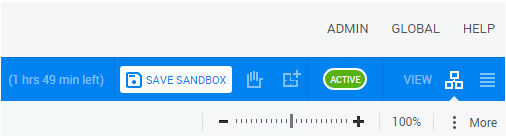
| 2 | The Sandbox menu enables you to end, update and extend the sandbox, show the physical layer and save the sandbox as a blueprint. | ||||||||||||||||||||||||||||
| 3 | The name of the sandbox. Click to change. | ||||||||||||||||||||||||||||
| 4 | Time left indicator. | ||||||||||||||||||||||||||||
| 5 | Saves an Active or Active (with Error) sandbox if you have a license for the Save and Restore paid add-on. See Sandbox Save and Restore Overview for more information. | ||||||||||||||||||||||||||||
| 6 | End sandbox / Extend sandbox buttons. | ||||||||||||||||||||||||||||
| 7 | Sandbox status | ||||||||||||||||||||||||||||
| 8 | The workspace view mode. Diagram view provides a graphical representation of the sandbox. List view displays the sandbox elements in a list. | ||||||||||||||||||||||||||||
| 9 | Click the Resource, App / Service, or Abstract button to add the suitable resource to your sandbox. | ||||||||||||||||||||||||||||
| 10 | Review the instructions of the sandbox. This option is available only if the sandbox has instructions. | ||||||||||||||||||||||||||||
| 11 | Review and execute the sandbox commands. CloudShell's blueprint template includes preconfigured setup and teardown commands. | ||||||||||||||||||||||||||||
| 12 | Opens the Activity Feed pane, displaying information about actions and commands performed in the sandbox. | ||||||||||||||||||||||||||||
| 13 | Opens the Output console, which displays detailed information related to running blueprint and resource commands. | ||||||||||||||||||||||||||||
| 14 | Show the diagram in a mini-map on the workspace. You can drag the map to change the view in the workspace. | ||||||||||||||||||||||||||||
| 15 | Use these buttons to change the size of the icons in the workspace. | ||||||||||||||||||||||||||||
| 16 | Displays labels that are currently being used in the diagram. | ||||||||||||||||||||||||||||
| 17 | Toggle left or right to zoom in or out of the workspace. | ||||||||||||||||||||||||||||
| 18 | Enter the zoom percentage. Default is %100. | ||||||||||||||||||||||||||||
| 19 | Displays all the sandbox workspace tools and options in a pane. See the image below.
|
Sandbox Diagram view
Diagram view is the default view for the sandbox. Depending on your permissions level, it enables you to add elements to your sandbox, such as resources and Apps, as well as define connectivity requirements between these elements, and set the sandbox's properties, including description, duration, and email notification policy.
Here, you can view and run sandbox and resource commands, track command progress in the Output console and Activity Feed, and view the sandbox's Instructions.
Sandbox List view
List view displays the sandbox's elements and their sub-resources in a list.
By default, the sandbox is displayed in Diagram view. The default view mode can be changed using the ShowListViewByDefault key.
For more information, see Sandbox List View.
Monitoring sandboxes
The sandbox workspace includes several monitoring aids that update in real time.
Sandbox state
The current state of the sandbox is indicated in the toolbar by an icon that shows the sandbox state and color.
For example:
State | Description |
|---|---|
| Sandbox is scheduled for future use. |
| Setup command is currently running. Sandbox is not available for use. During setup, CloudShell reserves the sandbox's resources for the sandbox's time slot, and deploys layer 2 connections and Apps. |
| Sandbox is currently active and ready for use. |
| Sandbox is currently active and ready for use. Setup was not completed successfully. |
| Teardown command is currently running. Sandbox is not available for use. During teardown, CloudShell releases the sandbox's resources to allow others to use them, powers off the Apps and deletes them from the cloud provider, and disconnects layer 2 connections. |
| Sandbox ended and is not available for use. The sandbox is no longer considered active and does not hold any resources. |
| (Requires the |
 Saving Saving | Save command is currently running. Once saving is complete, status returns to Active. You can only save a sandbox that is Active or Active (with Error). For additional information, see Save a Sandbox. |
 Pending
 Setup
Setup Active
 Teardown
 Completed
 Overtime
Hovering the cursor over the sandbox status icon opens a tooltip that includes an indication of the time to end of the current state. This is applicable for pending, setup and active states only.
In the case of setup, the popup opens automatically and closes when you click outside the popup.
For actions that are permitted during each of the sandbox states, see Permissible actions according to sandbox status
Note: The status bar in the sandbox workspace displays the remaining sandbox time continuously.
Live status indications
Live status indications are used to indicate the current status of reserved sandboxes and sandbox components, such as Apps and resources.
Live status is activated via TestShellAPI commands.
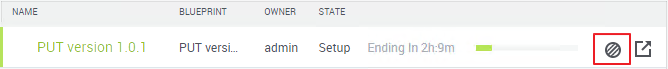
Sandbox live status
For sandboxes, the live status indication is displayed in the sandbox workspace and in the Sandboxes dashboard.
For example, a sandbox in Setup state has an "In Progress" live status icon:
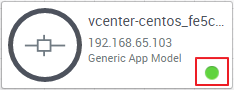
Resource live status
For reserved components, the live status indication is displayed in the sandbox workspace (Diagram and List views) and in the Inventory dashboard.
For example, a deployed App in a sandbox has an "Online" live status icon:
Sandbox Sharing indication
The sharing indication informs the user when other users are viewing the same workspace. Click the  icon to see a list of users.
Note: Only permitted users or administrators can open the workspace.
Sandbox attachments
Files can be attached to sandboxes via API. When a file is attached to a sandbox a dedicated icon is displayed both in the Sandboxes dashboard and in the sandbox workspace. The attached files can be downloaded through the API (for administrators only) or from the CloudShell Portal.
Note: Downloading attached files is available only to permitted users.
To download an attachment:
- In the Sandboxes dashboard or workspace, in the toolbar, click Attachment.
- From the list of attached files, select the required file to download.
The file is downloaded to your local drive. If the file type is identified, it will automatically open once the download is complete.
Custom sandbox data
Starting with CloudShell 9.2, it is possible to add custom data to the sandbox to be used by automation processes running in the sandbox. Note that this information is not presented in CloudShell Portal and can only be managed via the API. For additional information, see CloudShell Dev Guide.